
Rock Measurement
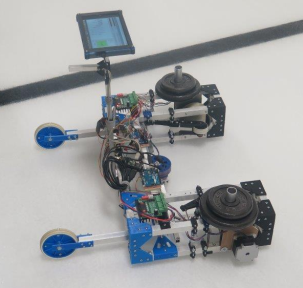
Our SweepTracker rock launching robot can measure rock travel for matching rocks
We have developed a technique to efficiently measure curl and distance travelled by curling rocks for the purposes of matching the rocks. Top level curlers know that matching the rocks in pairs leads to more consistent shots. But before SweepTracker, matching rocks required keeping track of rock behaviour and recording it in a rock book.
SweepTracker and our process allows for measuring 6 sheets of rocks in six hours. The results are provided in tables that teams can use to pair up their rocks as they see fit. At our home club of Dixie Curling Club, we have matched the rocks on three occasions, and players have used and appreciated the results.
We have been working with our SweepTracker curling robot for several years. It has been used for testing sweeping effectiveness, comparing curling brushes, sweeping techniques, and rock matching. We have dozens of hours of testing experience and launched hundreds of rocks with SweepTracker.The most important conclusion from this work is that curling ice is a very tricky thing to work with. We all know from playing the game that the ice changes as rocks run over it and sweepers brush the ice. What becomes obvious when you do the testing such as we have done is that this can vary a huge amount even on a single sheet.
To give an example, in order to get reasonably consistent test results we have an extensive ice preparation protocol. First the ice is scraped, pebbled, and nipped as it would be for a game. Next, we put eight rocks in a rock box and drag them up and down the sheet six times each way. Finally, we pick the path which we are going to use for testing and launch several rocks down that exact path until they consistently stop at the same location. Typically, after dragging the rocks, we still need to launch about six rocks down the identical path before it becomes consistent. The difference between the first rock on the path and the sixth is usually about 8 to 10 feet – after it has been dragged twelve times. (This is why it is so hard to throw lead rocks!)
This is the procedure we used when doing rock measurements. Occasionally when a rock seemed to exhibit anomalous behavior, we repeat the measurement.
Measurements
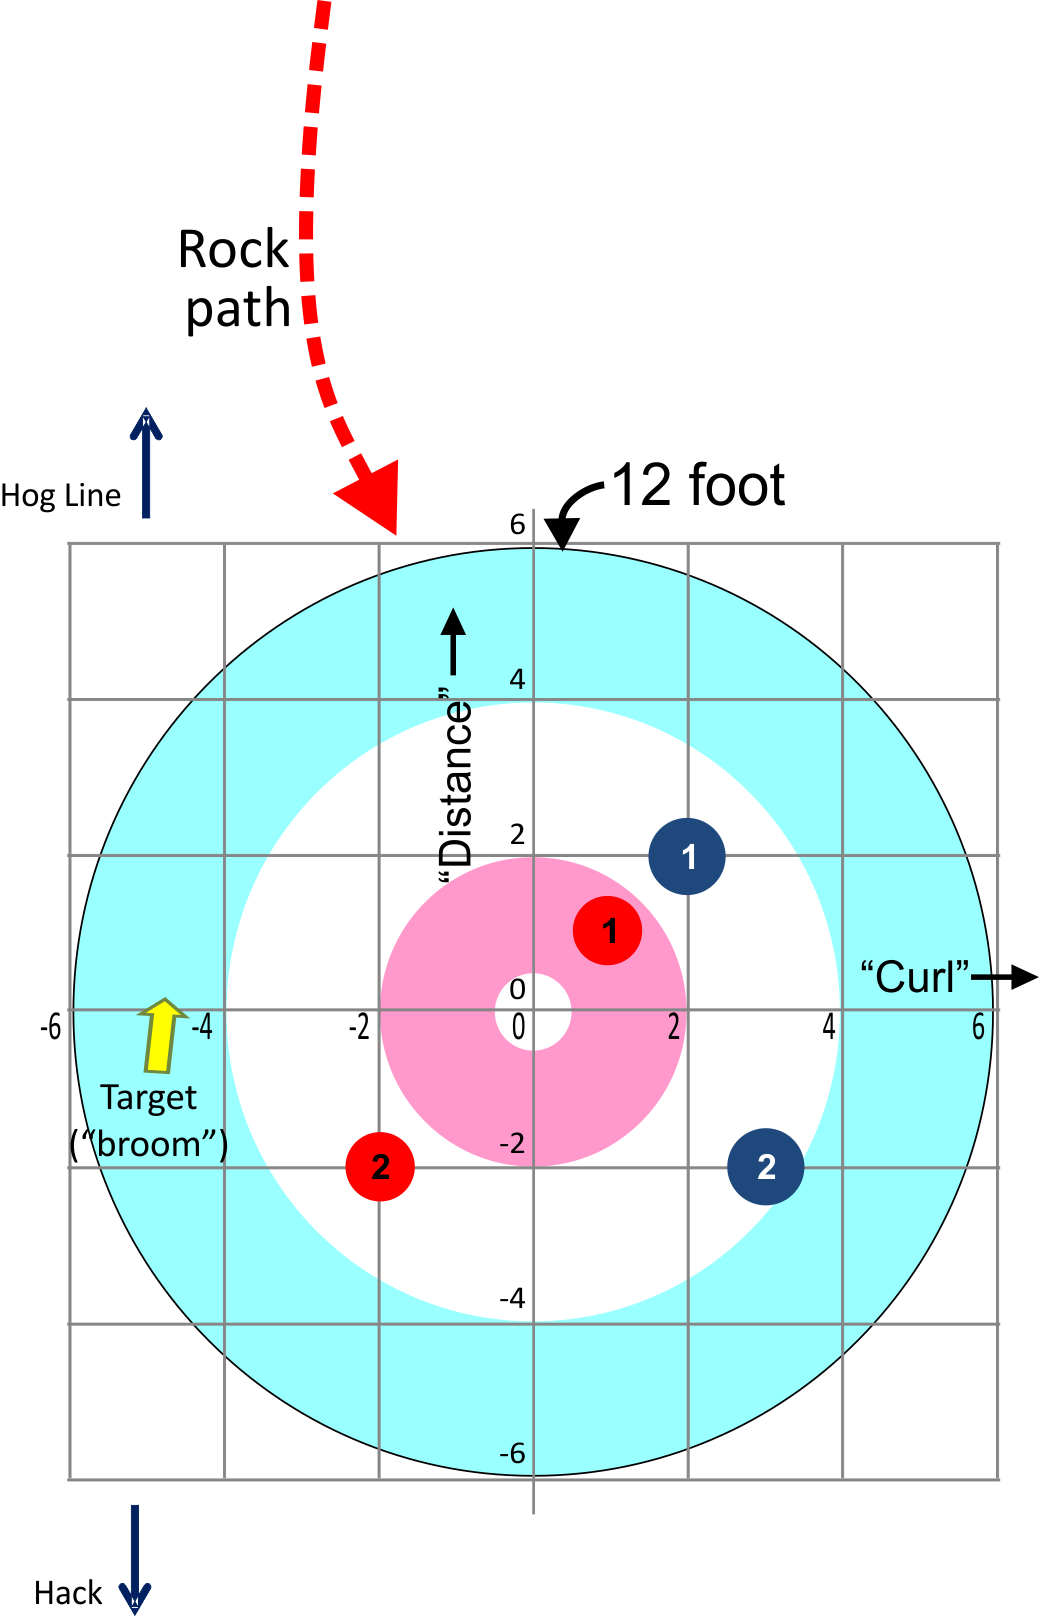
The image above shows example results from the rock matching measurements, and the table below summarizes the results.
The robot launches the rocks on an identical path towards the Target.
The “curl” column in the numbered results represents how far to the right or left of the centre line the rock travelled, with positive numbers being to the right of centre. The “distance” column in the results is the distance in front of (positive numbers) or behind (negative numbers) the tee line.
Based on the rock positions in the image, the data would be as in the table below. The two blue rocks both curled to the right of centre, but #2 travelled further than #1. The red #2 didn’t curl past centre, but travelled behind the tee line.
| Rock ID | Distance | Curl |
| Blue 1 | 2.0 | 2.0 |
| Blue 2 | -2.0 | 3.0 |
| Red 1 | 1.0 | 1.0 |
| Red 2 | -2.0 | -2.0 |
Note that the important takeaway is the similarity of performance; the amount of curl and distance travelled will change based on many, many variables.